Table of Contents
Willamette has collected materials about creating accessible documents, see them at MyWillamette > Creating Accessible Materials.
Want to make some big improvements to the accessibility of your Canvas course? It might be easier than you think!
There are several common ways to add content to Canvas:
Following these best practices for adding content will get you quite far in making your course usable by all.
Images add to a rich and engaging online course. However, students with vision disabilities rely on a screen reader to describe images to them so that they can gather the same meaning and context as sighted students. Canvas has several ways to add images to course content. Check out the "Adding alt text to images" tab on the Using Images & Videos in Canvas page in this guide.
While it's easy just to copy and paste a link, this is not an accessible (or super helpful) way to link students to additional content.
Instead of pasting a link or creating a link that says something like "click here," write an explanation of where the link directs.
For example:
While more complex diagrams and tables might require alternative content or long descriptions, basic tables can be easily made accessible in Canvas.
Learn more about creating tables in Canvas in the "Building Accessible Tables" tab of this box.
While captions are necessary for students with hearing disabilities, they improve the experience for many, including:
Adding captions will make your videos more usable and future-proof. Options for captions include using a DIY method, or the suggestions for the tools below:
The "Accessibility Checker" tab in this box demonstrates Canvas's built-in tool that lets you identify possible accessibility issues in content that you build on Canvas.
Canvas comes with an easy-to-use built-in accessibility checker to help you keep your course materials to best practice accessibility standards for all of your students.
When you create or edit any page using the rich text editor (the default view), the accessibility checker icon appears directly below the content editor box.
![]()
If something in your text would cause problems for a viewer (such as formatting that would not work with screen readers, images without alt text for screen readers, or text placed against a background that would be difficult for viewers to read, etc), a warning bubble with a number of accessibility issues will appear beside the accessibility icon.

You can view and resolve these issues by clicking on the accessibility checker icon. This will bring up a side bar that explains the issue.

To resolve an issue, click the check box and click the "Apply" button. Canvas will automatically reformat the content for you!

Tables are useful for communicating relationships between data, especially when those relationships can be best expressed in a matrix of rows and columns. Tables should not be used to control layout. If your data is best presented in a table, try to keep the table simple. If the table is complex, consider dividing it into multiple smaller tables with a heading above each. A key to making data tables accessible to screen reader users is to clearly identify column and row headers. Use the Canvas Rich Content Editor (RCE)'s built-in Table functionality to format tables accessibly.
Tables should have captions and headings to assist screen readers in reading the data correctly.
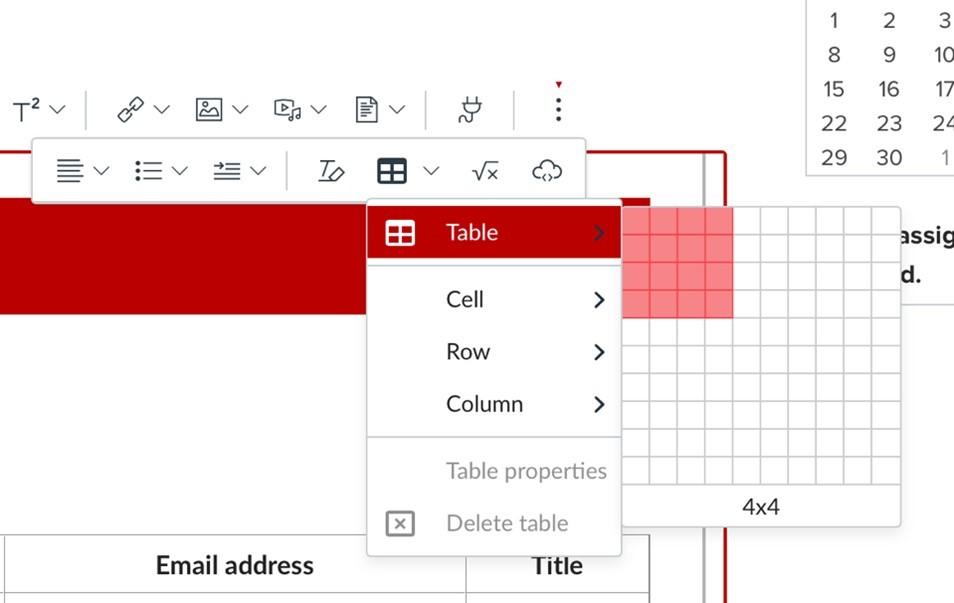
To create a table:
IF THE TABLE ICON IS NOT VISIBLE, click the three-dot icon 
Click the table icon 
Click Table to open a grid panel.
Hover your mouse over the grid to select the desired configuration of columns and rows, then left-click to add table.
Captions can be used to associate a short description to the table. Captions are not required, but they may be helpful in providing additional context. Captions provide more context to tables and appear in a row above your table's content. Keep captions clear and concise.
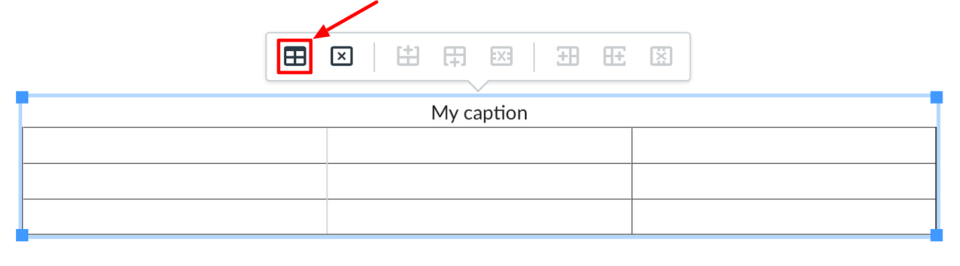
To add a caption to an existing table:
Click on a cell in a table in your Canvas content. The table's floating toolbar will appear.
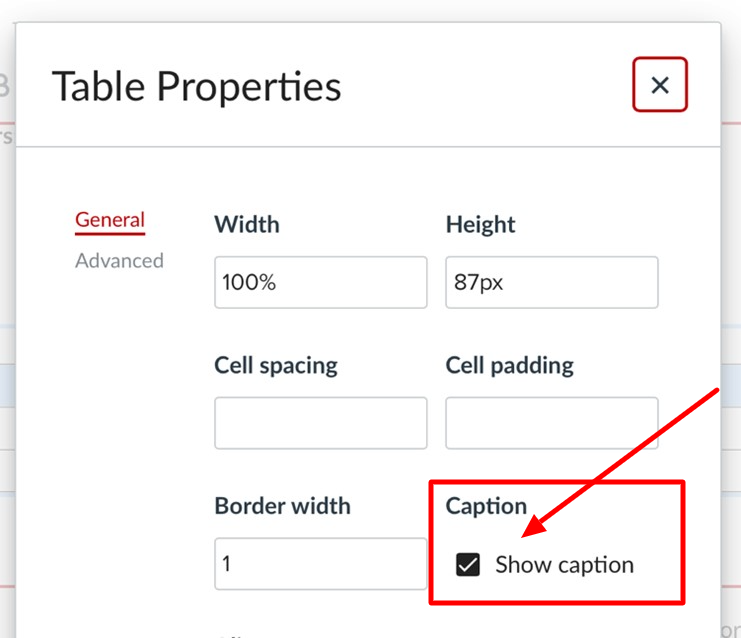
Select the table icon on the floating toolbar. The Table Properties box will open.
In the Table Properties box, under Caption, check the Show caption box.
Click Save. Space will be added above the table for the caption.
Add your caption in the added space above the table.
Table headers help describe how table contents are related. Whenever possible, make your tables simple: one header row, one column of header cells, no merged cells. If this is not possible, consider whether you could divide it into multiple smaller tables with a heading above each.
Select to highlight cells in the header row.
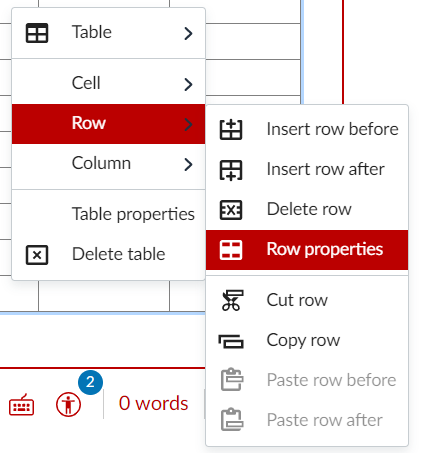
IF THE TABLE ICON IS NOT VISIBLE, click the three-dot icon
Click the table icon
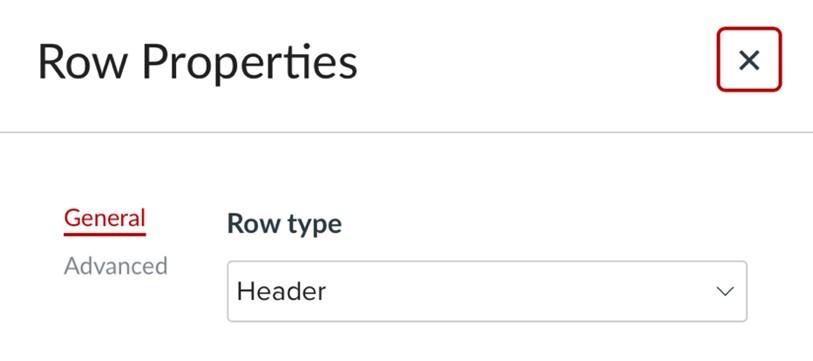
Click Row.
Click Row Properties. The Row Properties box will open.
Under Row type, click Header.
Click Save.
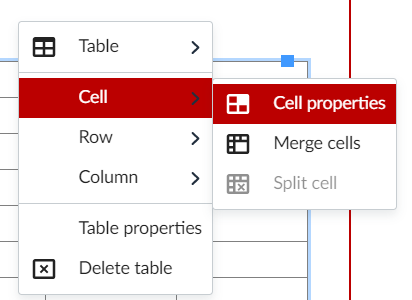
Select to highlight one or more cell(s).
IF THE TABLE ICON IS NOT VISIBLE, click the three-dot icon 
Click the table icon
Click Cell
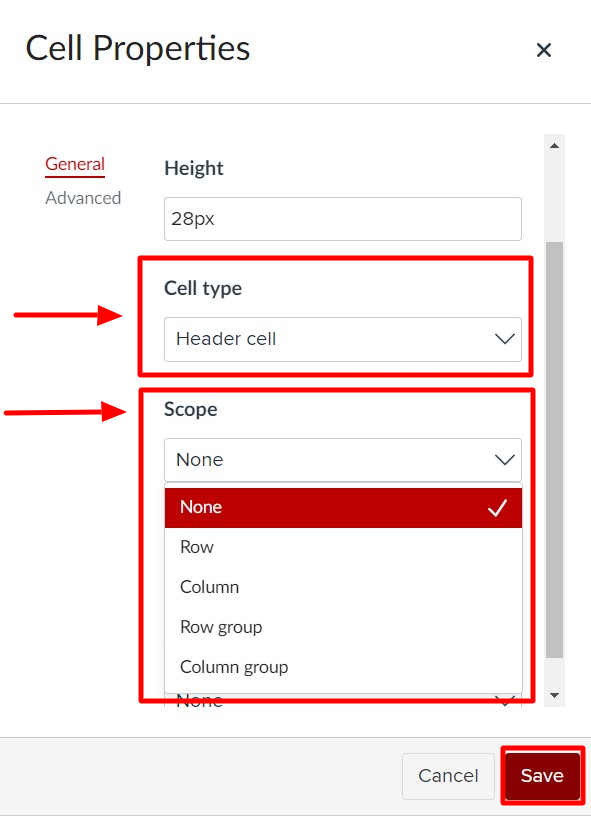
Click Cell Properties. The Cell Properties box will open.
Under Cell type, click Header cell.
Under Scope, click Row (i.e., the header cell describes data cells in the same row) or Column (i.e., the header cell describes data cells in the same column),
Click Save.
Canvas gives you the ability to set up accommodations you may need for some of your students.
Kaltura will auto-generate captions that can be edited for accuracy and timing for any videos you upload to your Media Gallery. However, it will NOT retroactively do this for videos that were already in your WISE Media Gallery.
You have access to many programs that will auto-generate captions for videos or allow you to add captions to your video files. Learn more on the Subtitles and captions subpage of the Digital Learning Studio's online tutorial guide (DLS tutorial guide > Video editing page > Subtitles and captions subpage).
These directions are also available as a downloadable PDF (below).
Most pdfs that you get from the library or a database are probably already accessible. To check, you can open a pdf in Adobe Acrobat and attempt to highlight or underline words. If this is successful, your pdf is probably accessible.
Click on the "All tools" menu in the top left corner.

Click on “Scan & OCR” from the drop down menu.

In the new menu that appears, select "Enhance file," and "Enhance scanned file."

A pop-up window will appear. You can choose to enhance all pages, current page, or page range. Set your selection, then click the blue button reading "Enhance."

A progress bar will appear in the lower right corner of your Acrobat window while the file is being enhanced. It will disappear when the process is complete.

Don't forget to save your document! If you want to keep an unedited copy of your scan, select "Save As..." and give the remediated file a new name.
Finally, in the left column under the menu heading "Recognize text," select "In this file." You can recognize text in multiple files if you prefer.
Once you have enhanced your PDF and recognized text, you can modify page elements to ensure clarity when reading. This can include:
After enhancing the file and recognizing text in Acrobat, select "All tools" from the main menu at the top left.
Next, select "Edit PDF" from the menu that appears.

You will now see dashed boxes around key elements in your reading. This may include:
Acrobat will create several text boxes for various sections (see screenshot below).

For scans like the one above, you can click on a dashed box or the background image to remove the selection, unwanted text or imagery (like the spine of the book and negative space in the scan).
Once selected, press backspace or delete to remove the unwanted text or selection. The screenshot below shows the edited version of the scanned PDF with the previous chapter's text, book spine, and negative scanned space removed.

Finally, if your scanned text was cut off or mis-scanned, click on the appropriate box. You will be able to modify text to reflect the correct word or letter.
Be sure to save your document! If you would like to keep an original version of your PDF, select "Save As..." and give your edited PDF a new title.
For additional questions regarding accessible documents, please reach out to Accessible Education Services (AES) at accessible-info@willamette.edu, or 503-370-6737.
Tech support: For technical assistance, start a ticket with WITS
Brainstorming: For ideas on how to use tools in your course, contact the DLS